HTTP Transfer Timing Needs More Than a Stopwatch
Two HTTP requests can take the same total time for very different reasons. One may spend most of its observed interval establishing a connection. Another may receive its first response byte quickly and then spend longer reading the body. A stopwatch hides that distinction.
Inspect records trace events and keeps the interval boundaries explicit. Some events can be missing or ambiguous. Concurrent connection attempts also make a neat additive waterfall less honest than it looks. The report leaves unavailable values unavailable instead of filling them with zeroes.
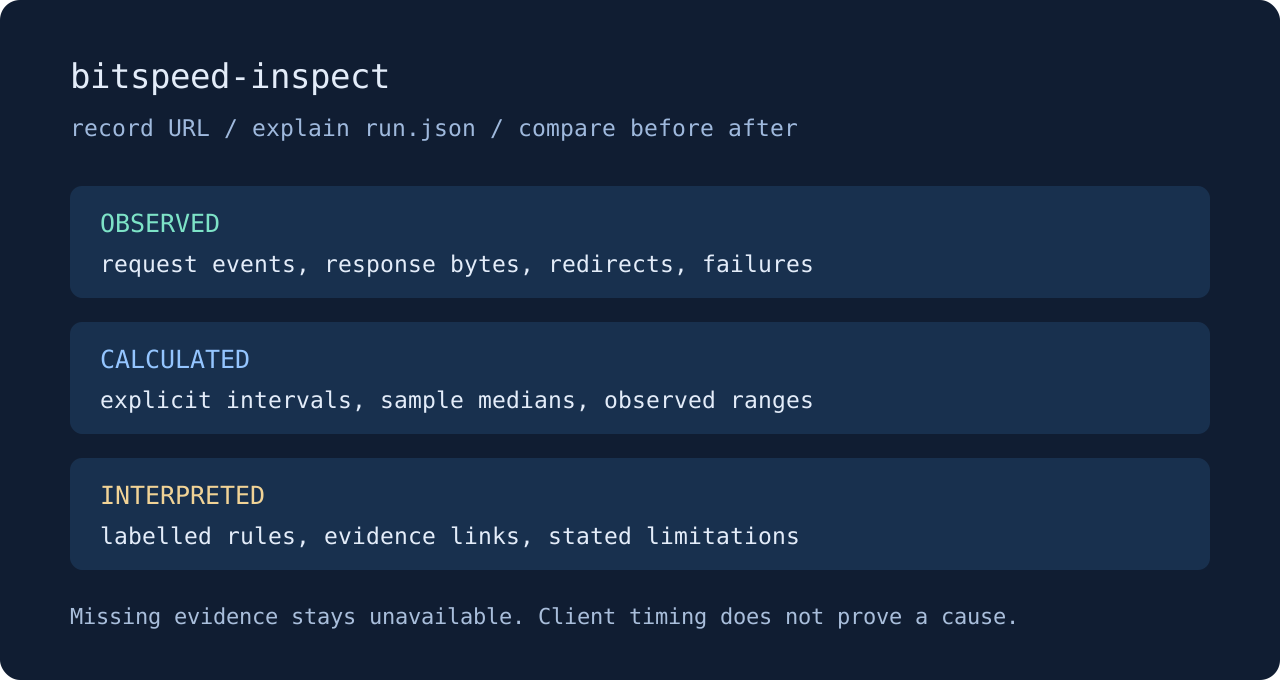
Waiting for a first byte is particularly easy to overinterpret. The client sees a boundary between writing the request and observing the response. It does not see a database query or a CPU scheduler inside the origin. Any causal explanation needs additional evidence from the system being investigated.
A before and after comparison helps when its requests are comparable. Target identity, settings, payload size, compression and protocol all affect what can fairly be compared. Inspect reports those checks alongside sample counts and observed ranges. Sometimes the useful answer is simply that this set of samples cannot support a stronger conclusion.
The Inspect guide covers the practical boundaries. Try the local fixture to see delayed headers and delayed body chunks separately.